Drill baby, drill!
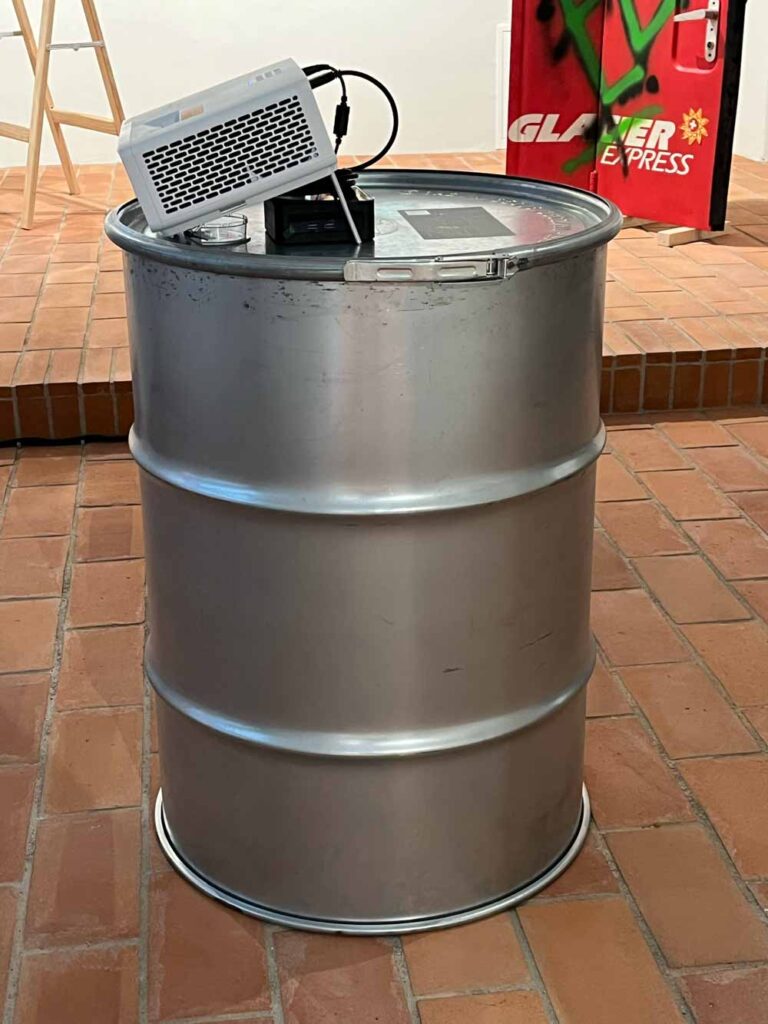
object, 60 x 82 cm
The 42-gallon (159 litres) barrel became customary in 1866 and was adopted by the US Petroleum Producers Association in 1872 and it serves as a saleable unit for crude oil. Its price peaked in 2008.
In 2022 oil contributed 30% of the global energy supplied while producing 32.7% of combustion emissions.
OpenAI. (2026). ChatGPT (GPT-5.6) [Large language model]. See prompts at the end
Drill, Baby, Drill! — The Oil Barrel
Standardisation, extraction, infrastructure, markets, sectoral dependence and transition risk
Scope: The emergence of the 42-US-gallon petroleum barrel; the history and present organisation of oil extraction; production, infrastructure, prices and political economy; sectoral dependence on oil and competing energy carriers; lifecycle emissions; and contrasting futures for petroleum under current-policy and climate-constrained scenarios. The report distinguishes crude oil from broader “liquids”, physical barrels from the abstract trading unit, and verified evidence from the installation’s parafictional framing.
Abstract
The petroleum barrel is both a historical container and a durable abstraction. A 42-US-gallon measure, equivalent to 158.987 litres, became customary in Pennsylvania’s oil trade in 1866 and was adopted by the Petroleum Producers Association in 1872. Long after pipelines and tankers displaced wooden barrels, the unit remained the basic language of production, reserves, prices and futures contracts. Oil grew from a nineteenth-century illuminant into a global system of wells, pipelines, terminals, refineries, shipping lanes, petrochemical plants and financial benchmarks. In 2024 its share of global energy demand fell below 30 per cent for the first time, yet 2025 production remained at record scale and road transport alone still represented roughly 45 per cent of oil demand. The barrel’s climatic consequence is similarly scalar: consuming one average barrel releases about 0.43 tonnes of CO2 from combustion, before upstream methane, flaring and refining are counted. Current-policy outlooks preserve substantial oil demand to mid-century, while climate-compatible pathways require a rapid decline and leave significant reserves unextracted. Within The Sunshine Find, the barrel links material extraction to an accounting system that converts geological time, landscapes and atmospheric capacity into a saleable unit.
Contents
1. The barrel: container, standard and commercial abstraction
2. From oil seep to planetary industry: a history of extraction
3. Present production and infrastructure
4. Prices, benchmarks and the political economy of volatility
5. Oil in the current global energy system
6. Sectoral dependence: where oil can and cannot be displaced quickly
7. Emissions: from one barrel to the global carbon budget
8. The future of oil production
Primary and institutional evidence links
Numbered Academic Reference List
Appendix: User prompts related to this report
1. The barrel: container, standard and commercial abstraction
The oil barrel did not originate as a universal scientific unit. It emerged from the practical disorder of the early Pennsylvania petroleum boom, where crude moved in whatever containers were available: whiskey barrels, salt barrels, casks and improvised tanks. Variations in capacity, leakage and dishonest filling created a market problem. Buyers needed a recognised quantity that could be priced, inspected, taxed and compared across producers. The 42-gallon standard stabilised exchange before it stabilised the physical container itself.
1.1 Standardisation chronology
Date / period | Development | Historical significance |
Before the 1860s | Barrels of different capacities circulated in wine, spirits, salt and other trades. Early petroleum producers reused available containers. | “A barrel” described a vessel before it described a trustworthy petroleum quantity. |
1859-1865 | The Oil Creek boom rapidly expanded production, storage and shipment in western Pennsylvania. | Volume disputes became commercially costly as crude changed hands through increasingly long chains of traders and transporters. |
1866 | A 42-US-gallon petroleum barrel was promoted as customary trade practice. | The extra volume above a nominal 40 gallons also accommodated losses, residues and measurement practices, although historical explanations vary. |
1872 | The Petroleum Producers Association adopted the 42-gallon measure. | The trade convention became an industry rule for sales and reporting. |
Late nineteenth century | Federal and geological statistical work used the standard. | Official compilation helped entrench the barrel beyond Pennsylvania. |
Twentieth century to present | Pipelines, tank cars, tankers and storage tanks displaced literal barrels for bulk crude. | The barrel survived as a notional accounting, pricing and contractual unit: 1 bbl = 42 US gallons = 158.987 litres. |
Academic source links: Petrolia: The Landscape of America’s First Oil Boom | Oil and Ideology
References: [1]; [2].
Primary / institutional evidence links: Petroleum History Institute: Standardization | American Oil & Gas Historical Society: History of the 42-Gallon Oil Barrel
1.2 What the unit measures — and what it does not
Expression | Meaning | Important limitation |
1 petroleum barrel (bbl) | 42 US liquid gallons; 158.987 litres. | It is a volume, not a fixed mass or energy quantity. Density and heating value vary by crude grade. |
barrels per day (b/d, kb/d, mb/d) | A flow rate used for production, refinery throughput, consumption or transport. “mb/d” is used here for million barrels per day. | Published conventions vary: some use “Mb/d” for million, others for thousand. Definitions must be checked. |
barrels of oil equivalent (boe) | An energy-equivalence convention that combines oil, gas and sometimes other hydrocarbons. | A company’s boe/d is not the same as its crude-oil output and cannot be compared directly with a crude-only country ranking. |
futures contract | A standard WTI futures contract commonly represents 1,000 barrels for delivery under specified terms. | The quoted paper contract is a claim on standardised delivery, not 1,000 physical drums. |
tonnes of oil equivalent (toe) | An energy unit used in international statistics. | Conversion between toe and barrels depends on assumed energy content; there is no universal exact barrel-to-tonne ratio for all crudes. |
The persistence of the barrel demonstrates an infrastructural principle central to this project: a standard can outlive the material form that generated it. Most crude oil is never placed in a 159-litre drum. It is metered through pipes, held in tanks and moved in ships, while the “barrel” continues to organise contracts, headlines, budgets and emissions calculations. The object is therefore simultaneously literal and conceptual.
1.3 “Drill, baby, drill!”: abundance as political language
The object title refers to a slogan popularised at the 2008 Republican National Convention, where Michael Steele used the phrase in support of increased domestic oil and gas production. Its force lies in repetition: extraction is presented as immediate, technically simple and synonymous with energy independence. The slogan suppresses the time lag between leasing, exploration, permitting, drilling and production; it also obscures the difference between domestic output and the globally priced oil market. Its historical coincidence with the nominal daily price peak of 2008 is significant. A moment of extreme price anxiety produced a political demand to enlarge supply, even though price formation reflected global demand, spare capacity, financial conditions and geopolitical risk rather than a single national drilling decision.
Academic source links: “An Inevitable Consequence”: Changing Ideas of Prevention in the Wake of Catastrophic Events | Oil
References: [28], 1-31; [3]; [4].
Primary / institutional evidence links: Carbon Brief history of the slogan
2. From oil seep to planetary industry: a history of extraction
Petroleum was used for waterproofing, medicine, lighting and warfare long before the modern oil industry. What changed in the nineteenth century was not the discovery of the substance but the creation of a reproducible system for drilling, refining, transporting and selling it at industrial scale. Edwin Drake’s 1859 well near Titusville is conventionally treated as a founding event in the United States, but “first well” claims depend on how one defines drilling, commercial purpose and geographic scope. The historically safer claim is that the Pennsylvania boom catalysed a modern integrated petroleum industry and a new landscape of derricks, tanks, pipelines, refineries and boomtowns.
2.1 Major historical transformations
Period | Technical / institutional change | Consequences |
Ancient to early modern | Collection from natural seeps; use of bitumen and naphtha in construction, lighting, medicine and warfare. | Petroleum existed as a local material, not yet as a globally standardised energy system. |
1850s-1870s | Commercial drilling, kerosene refining, pipelines, rail shipment and the Pennsylvania boom. | Oil displaced whale oil and other illuminants; the barrel and “rule of capture” organised a volatile new market. |
1870s-1911 | Vertical integration and Standard Oil’s control of refining, transport and distribution. | Corporate coordination reduced some costs while creating monopoly power and political opposition. |
1900s-1945 | Automobility, internal-combustion engines, naval conversion from coal to oil, and discoveries in Russia, Mexico, Venezuela and the Middle East. | Oil shifted from illumination to mobility and strategic power. |
1945-1973 | Mass motorisation, suburbanisation, aviation, petrochemicals and expansion of transnational concession systems. | Cheap oil became embedded in roads, plastics, agriculture, military logistics and consumer culture. |
1960-1980s | Formation of OPEC, nationalisation and the rise of national oil companies; 1973 and 1979 shocks. | Producer states gained greater control over reserves, rents and posted prices. |
1970s-2000s | North Sea, Alaska, deepwater, oil sands, enhanced recovery and computerised seismic imaging. | Production expanded into colder, deeper and more capital-intensive frontiers. |
2000s-2010s | Horizontal drilling and hydraulic fracturing transformed US tight oil; deepwater production grew. | Short-cycle shale altered global supply responsiveness and returned the United States to the top producer position. |
2015-present | Digital field management, methane monitoring, carbon-intensity differentiation, consolidation and selective investment in low-carbon businesses. | The industry remains hydrocarbon-centred while operating under increasing climate, financial and regulatory pressure. |
Academic source links: Petrolia | Oil and Ideology | Carbon Democracy | Oil
References: [1]; [2]; [3]; [4].
2.2 Extraction frontiers and the redistribution of visibility
Early oil districts were visibly saturated with production: derricks, fires, mud, barrels and refineries crowded the extraction landscape. Contemporary oil is both more extensive and less immediately visible to many consumers. Offshore platforms, desert fields, Arctic prospects, oil sands, subsea pipelines and remote export terminals displace the material violence of production away from the filling station, airport or plastic object. This spatial separation is not accidental. Pipelines and shipping corridors connect sacrifice zones, industrial nodes and consumer centres while distributing responsibility across firms, states, contractors and financial instruments.
The move from conventional reservoirs to deepwater, tight oil and bitumen also complicates any simple equation between “one barrel” and a uniform environmental burden. Barrels with similar market value can require very different quantities of steam, electricity, water, flaring and processing. The trade unit standardises volume precisely where geology and lifecycle impact remain heterogeneous.
Academic source links: Material Politics: Disputes Along the Pipeline | Global Carbon Intensity of Crude Oil Production
References: [5]; [19], 851-853.
3. Present production and infrastructure
3.1 Production definitions and scale
Oil statistics often appear contradictory because several aggregates circulate under the same word. “Crude oil” may include lease condensate; “petroleum and other liquids” can add natural-gas liquids, refinery gains, biofuels and other products; “oil supply” in market reports may use still another convention. For 2025, the Energy Institute reported record energy demand and a continuing geographical shift in production, while the EIA recorded a world-leading 13.6 million barrels per day of US crude oil plus lease condensate. The attached study’s country table remains a useful crude-only benchmark, but its figures should not be combined uncritically with total-liquids data.
Rank | Country | Approx. 2025 crude oil + lease condensate (mb/d) | Interpretive note |
1 | United States | 13.6 | Record output; productivity and the Permian Basin were decisive. |
2 | Russia | 9.9 | Output remained broadly flat under voluntary cuts, sanctions and war-related constraints. |
3 | Saudi Arabia | 9.6 | Large spare-capacity role; output shaped by OPEC+ policy. |
4 | Canada | 5.0 | Oil sands and conventional production linked strongly to US refining markets. |
5 | Iraq | 4.4 | Large reserves and high fiscal dependence; infrastructure and politics constrain expansion. |
6 | China | 4.3 | Major producer but a much larger consumer and importer. |
7 | Iran | 4.1 | Production and exports shaped by sanctions and regional geopolitics. |
8 | United Arab Emirates | 3.8 | Expanding capacity and export infrastructure. |
9 | Brazil | 3.8 | Deepwater pre-salt production drives growth. |
10 | Kuwait | 2.6 | State-led production integrated with OPEC+ management. |
Academic source links: Oil
References: [3].
Primary / institutional evidence links: EIA: The United States produced more crude oil than any other country in 2025 | EIA International Energy Statistics | Energy Institute Statistical Review of World Energy 2026
3.2 The oil system as a chain of infrastructures
Segment | Principal assets | Economic / environmental function |
Exploration | Geological surveys, seismic vessels, test wells, leases and data systems. | Converts subsurface uncertainty into reserves, licences and investment prospects. |
Upstream production | Onshore wells, offshore platforms, subsea systems, pumps, water/steam injection, gathering systems. | Raises crude and associated gas; produces methane, flaring, water and land or marine disturbance. |
Field treatment | Separators, stabilisation, desulphurisation, gas processing and produced-water systems. | Makes crude transportable and defines saleable quality. |
Midstream transport | Gathering pipelines, trunk pipelines, rail, barges, tankers and pumping stations. | Moves large volumes continuously; creates corridor politics, spill risk and chokepoint exposure. |
Storage and trading | Tank farms, salt caverns, strategic reserves, floating storage, terminals and commodity exchanges. | Balances time between production and use; inventories shape prices and security policy. |
Refining | Atmospheric and vacuum distillation, cracking, reforming, hydrotreating and coking. | Separates and upgrades crude into fuels, lubricants, bitumen and feedstocks; energy use varies with crude and product slate. |
Petrochemicals | Steam crackers, aromatics complexes, polymer plants and fertiliser/chemical chains. | Converts oil and gas fractions into plastics, fibres, solvents and chemical intermediates rather than immediately burning them. |
Distribution and use | Product pipelines, depots, service stations, airports, ports, vehicles, boilers and industrial machinery. | Embeds oil in everyday mobility and production; most lifecycle CO2 appears when products are finally burned. |
Decommissioning / afterlife | Plugged wells, dismantled platforms, contaminated sites, abandoned pipelines and waste. | Creates long-duration liabilities that survive the revenue-generating phase. |
Academic source links: Material Politics | Oil | Carbon Intensity of Global Crude Oil Refining and Mitigation Potential
References: [3]; [5]; [20], 526-532.
3.3 Chokepoints, storage and the geopolitics of continuity
Oil’s fungibility is often overstated. Crude grades differ, refineries are configured for particular slates, and transport capacity is geographically specific. The system therefore depends on a small number of high-volume corridors and maritime passages. In 2025 approximately 20 million barrels per day of crude and products moved through the Strait of Hormuz, around one quarter of world seaborne oil trade. Malacca, Suez/SUMED, Bab el-Mandeb and the Turkish Straits are similarly important. Strategic reserves, commercial inventories, spare production capacity, rerouting and demand restraint provide buffers, but none is instantaneous or unlimited.
The 2026 price volatility captured in current official outlooks demonstrates how infrastructure turns geopolitical events into market expectations. A disrupted passage does not need to eliminate global supply permanently to move prices: the possibility of delay, insurance cost, stock draw and refinery shortage is sufficient. The barrel price is therefore a compressed judgement about geology, logistics, war, finance, policy and anticipated demand.
Academic source links: Material Politics | Carbon Democracy
References: [4]; [5].
Primary / institutional evidence links: IEA: Strait of Hormuz | EIA: World Oil Transit Chokepoints
3.4 Producers, companies and market organisation
Country and company power overlap but are not identical. National oil companies control many of the world’s largest reserves and often combine commercial production with fiscal, diplomatic and social functions. International oil companies remain influential in technology, finance, trading, deepwater production, refining and marketing. Independent firms and service companies play disproportionate roles in shale drilling and specialised technology. OPEC+ coordinates production policy among participating states, while futures exchanges, price-reporting agencies, refiners and trading houses translate physical flows into benchmark prices.
COMPARABILITY WARNING |
Saudi Aramco, Rosneft, ExxonMobil, Chevron, Shell and TotalEnergies publish large hydrocarbon-output figures, but those disclosures use different boundaries and often report barrels of oil equivalent rather than crude alone. A ranking that mixes crude, condensate, natural-gas liquids and gas creates an appearance of precision without a common denominator. The attached study’s company figures are retained as background evidence, not converted into a definitive league table. |
4. Prices, benchmarks and the political economy of volatility
4.1 How a barrel acquires a price
There is no single universal oil price. Brent, West Texas Intermediate and Dubai/Oman are benchmark systems linked to particular grades, delivery locations and trading practices. Physical crudes trade at premiums or discounts reflecting density, sulphur content, transport cost, refinery compatibility and regional balance. Futures prices add expectations about later delivery, interest rates, inventories and risk. OPEC+ targets, US shale responsiveness, spare capacity, sanctions, demand growth, recessions and exchange rates all influence the market, but their effects differ by episode.
Price concept | What it represents | Why it can diverge |
Brent | A North Sea-linked benchmark central to internationally traded crude. | Waterborne access and global use make it responsive to seaborne balances and geopolitical risk. |
WTI | A light sweet US benchmark delivered under contract at Cushing, Oklahoma. | Pipeline and storage constraints can separate inland US conditions from global seaborne markets. |
Dubai/Oman | Benchmarks widely used for Middle Eastern crude sold into Asia. | Quality and regional destination differ from Brent and WTI. |
Spot price | Price for near-term physical delivery. | Depends on immediate grade, location, freight and refinery demand. |
Futures price | Price in a standard contract for a specified future delivery month. | Can reflect storage economics, hedging and financial positioning as well as expected physical balance. |
Annual average | Mean price over a year. | Smooths shocks and should not be confused with a daily record high or low. |
Real price | Nominal price adjusted for inflation. | Historical “records” can change depending on deflator and base year. |
Academic source links: Not All Oil Price Shocks Are Alike | Forty Years of Oil Price Fluctuations | The Role of Speculation in Oil Markets
References: [6], 1053-1069; [8], 139-160; [9], 7-33.
4.2 Historical turning points
Date / period | Price movement | Principal drivers and interpretation |
1973-1974 | First major post-war oil shock. | Arab oil embargo, production decisions and the political aftermath of the Yom Kippur War exposed import dependence. |
1979-1980 | Second shock and renewed price surge. | Iranian Revolution, Iran-Iraq War and precautionary inventory behaviour tightened markets. |
1986 | Sharp collapse. | Saudi Arabia shifted strategy after losing market share; excess capacity and increased non-OPEC supply pushed prices down. |
1998 | Prices reached very low levels. | Asian financial crisis weakened demand while supply remained ample. |
11 July 2008 | WTI about US$147.27/bbl; Brent about US$147.50/bbl, the nominal daily benchmark peaks cited by the attached study. | Rapid demand growth, limited spare capacity, a weak dollar, supply disruptions and financial conditions combined. No single-cause explanation is sufficient. |
2014-2016 | Large decline from above US$100. | US shale growth, OPEC strategy and slower demand created oversupply. |
April 2020 | WTI’s expiring May futures contract settled below zero for one day; Brent fell below US$20. | Pandemic demand destruction, a Saudi-Russia price conflict and saturated storage produced an exceptional delivery-location crisis. Negative WTI did not mean all oil everywhere had a negative value. |
2022 | Brent annual average around US$101/bbl. | Russia’s full-scale invasion of Ukraine, sanctions, rerouting and post-pandemic demand raised prices. |
2025 | WTI annual average about US$65/bbl. | High production and oversupply coexisted with record US output. |
2026 at research cut-off | Official forecasts changed sharply month to month; EIA’s July outlook placed Brent at US$82/bbl average for 2026 and US$65/bbl for 2027. | Conflict, transit disruption, subsequent flow recovery and expected inventory rebuilding demonstrate the conditional nature of short-term forecasts. |
Academic source links: Causes and Consequences of the Oil Shock of 2007-08 | Not All Oil Price Shocks Are Alike | Forty Years of Oil Price Fluctuations
References: [6], 1053-1069; [7], 215-283; [8], 139-160.
Primary / institutional evidence links: EIA Short-Term Energy Outlook, July 2026 | FRED / EIA Brent Europe series | Energy Institute Statistical Review
4.3 Oil, growth, inflation and rent
Oil prices redistribute income between importers and exporters and between producers, refiners, transport firms and consumers. A supply-driven price rise can increase inflation, reduce real household income and weaken oil-importing economies, while raising export revenue and fiscal receipts for producers. A demand-driven rise caused by strong global growth has different macroeconomic meaning. This distinction is central to contemporary oil-price scholarship: identical price movements can have unlike causes and consequences.
For producing states, petroleum revenue can finance infrastructure, welfare and sovereign wealth funds, but it can also produce fiscal volatility, exchange-rate pressure, concentrated political power and delayed diversification. The “resource curse” is not an automatic geological fate; it is a contingent relationship among institutions, ownership, taxation, conflict, distribution and global markets. Nevertheless, dependence on oil rents creates a transition risk: climate policy or technological substitution can strand not only private assets but public budgets and social contracts.
Academic source links: Does Oil Hinder Democracy? | Natural Resources: Curse or Blessing? | Causes and Consequences of the Oil Shock of 2007-08
References: [7], 215-283; [10], 325-361; [11], 366-420.
5. Oil in the current global energy system
5.1 Interpreting the object label’s 2022 figures
The exhibition description states that oil supplied 30 per cent of global energy in 2022 while producing 32.7 per cent of combustion emissions. These figures function as a defensible historical snapshot within a particular statistical convention. They should be accompanied by three qualifications. First, “primary energy”, “total energy supply”, “final energy” and “electricity generation” are different denominators. Second, combustion emissions exclude part of the upstream methane, flaring, refining and embodied infrastructure footprint. Third, the global mix changes each year and statistical organisations periodically revise conversion methods.
The IEA reported that oil’s share of total energy demand fell below 30 per cent in 2024 for the first time, half a century after a peak near 46 per cent. This relative decline did not mean an absolute end to oil: demand still reached about 193 EJ in 2024, and oil use grew again in 2025, led by petrochemicals and aviation while road-fuel growth remained muted. The distinction between share and volume is therefore essential. A source can lose percentage share in a growing system while remaining at historically high absolute consumption.
EDITORIAL RECOMMENDATION FOR THE OBJECT LABEL |
Retain the 2022 figures as a dated statement, not as an unqualified description of the present. Suggested wording: “In 2022, under the source’s global energy-accounting convention, oil supplied about 30% of energy and produced 32.7% of combustion emissions. By 2024 the IEA reported that oil’s share of global energy demand had fallen below 30%, although absolute consumption remained near record levels.” |
Academic source links: Sociotechnical Transitions for Deep Decarbonization | A Low Energy Demand Scenario for Meeting the 1.5 °C Target
References: [12], 1242-1244; [13], 515-527.
Primary / institutional evidence links: IEA Global Energy Review 2025: Oil | IEA Global Energy Review 2026: Global trends | Energy Institute 2026 media release
5.2 Oil and renewables are not a single substitution contest
Comparisons between “oil” and “renewables” often collapse unlike energy functions. Wind, solar, hydro and nuclear mainly produce electricity. Oil is used predominantly as a liquid transport fuel and as a chemical feedstock. Renewable electricity can displace oil indirectly through electric vehicles, heat pumps, electrified industrial processes and hydrogen production, but it does not replace jet fuel, marine fuel or petrochemical feedstock merely by increasing its share of the power mix. Infrastructure, equipment turnover, storage, grids, material supply and regulation mediate the substitution.
Indicator | Recent / projected benchmark | What it means for oil |
Oil share of global energy demand | Below 30% in 2024 according to the IEA; absolute demand about 193 EJ. | Relative decline has begun, but the system remains oil-intensive. |
Global electricity growth, 2025 | Electricity consumption rose 3%; the Energy Institute reported that the increase was met entirely by low-carbon generation. | Power-sector decarbonisation can support EVs and electrified heat, but does not itself eliminate liquid-fuel demand. |
Renewable share of electricity | IEA forecast: 30% in 2023 to 46% in 2030. | Fast change in power creates the main technical route for indirect oil substitution. |
Renewable share of transport energy | IEA main case: about 6% in 2030. | Transport changes more slowly than electricity; biofuels, renewable electricity, hydrogen and e-fuels remain unevenly distributed. |
Road transport share of oil demand | About 45% globally. | Electrification of cars and some buses creates the largest near-term displacement opportunity. |
Aviation and marine transport | Currently almost entirely fossil-fuel dependent. | These sectors remain among the most persistent sources of future oil demand. |
Petrochemicals | A major and growing use; feedstocks and aviation drove most recent oil-demand growth. | Non-combustion use can continue even as road fuels decline, though plastics create their own lifecycle emissions and waste. |
Fusion energy | 0% of commercial global energy supply in 2026. | Fusion is an R&D prospect, not a present competitor in energy-mix statistics or a basis for delaying deployable transition measures. |
Academic source links: Sociotechnical Transitions for Deep Decarbonization | Magnetic-Confinement Fusion
References: [12], 1242-1244; [18], 398-410.
Primary / institutional evidence links: IEA Renewables 2024: Global overview | IEA Road Transport Fuels | IEA Global Energy Review 2025: Oil
6. Sectoral dependence: where oil can and cannot be displaced quickly
The following table does not assign a false universal percentage to every industry. Energy mixes vary by country, technology, product and statistical boundary. It instead combines robust global anchors with a structured assessment of present dependence and transition mechanism. “High” means that oil or another fossil fuel is currently integral to the dominant technical system, not that alternatives are impossible.
Sector / activity | Current dominant energy or feedstock | Quantitative anchor / dependence | Likely direction to 2030-2050 |
Passenger road transport | Gasoline and diesel; rapidly growing electricity. | Road transport represents about 45% of global oil demand; passenger vehicles use much of road energy. | Fastest large oil-displacement opportunity through EVs, public transport, smaller vehicles, modal shift and efficiency. |
Road freight and off-road machinery | Diesel, with limited electricity, biofuels and hydrogen. | Heavy loads, long duty cycles and slow fleet turnover preserve high oil dependence. | Battery-electric grows in urban and regional freight; long-haul pathways remain contested and infrastructure-dependent. |
Aviation | Kerosene / jet fuel. | The IEA describes aviation as currently almost entirely fossil-fuelled; it accounted for roughly half of 2024 oil-demand growth in energy terms. | Efficiency, demand management and sustainable aviation fuels grow, but residual oil or synthetic hydrocarbon demand remains high in most scenarios. |
Shipping | Fuel oil, marine gasoil and diesel; some LNG. | Marine transport is also almost entirely fossil-fuel dependent today. | Methanol, ammonia, biofuels, electrification of short routes and efficiency diversify the mix; global turnover is slow. |
Petrochemicals and plastics | Oil and gas liquids as feedstock and process energy. | Feedstocks represented around 70% of 2024 oil-demand growth in volumetric terms. | Circularity, material efficiency, mechanical/chemical recycling and alternative carbon reduce virgin fossil feedstock, but demand can continue growing under current policies. |
Electricity generation | Coal, gas, renewables, hydro and nuclear; oil is a minor global source but important in some islands and oil-producing states. | Renewables supplied 30% of electricity in 2023 and are forecast at 46% in 2030. | Oil-fired generation declines where grids, interconnection and renewables expand; gas and coal face separate transition pressures. |
Buildings and low-temperature heat | Electricity, gas, biomass, district heat and regional oil products. | Heat accounts for a very large share of final energy; oil’s role is geographically uneven. | Heat pumps, efficiency and clean district systems can reduce oil and gas, with building renovation as a major constraint. |
Steel | Coal/coke in blast furnaces; electricity in electric-arc furnaces; gas and emerging hydrogen. | Dependence is primarily on coal rather than oil; oil is indirect through mining and transport. | Scrap-based electric production, direct reduced iron, hydrogen and material efficiency can cut coal use. |
Cement and concrete | Coal, petcoke, gas, waste-derived fuels and electricity; unavoidable process emissions from calcination. | Oil products can appear as petcoke or transport fuel, but process CO2 is distinct from energy combustion. | Clinker substitution, electrification, alternative fuels, efficiency and carbon capture are required; no single fuel switch solves the sector. |
Agriculture, mining and construction | Diesel for tractors, excavators, haul trucks and generators; gas for fertiliser production. | High off-road oil dependence is embedded in mobile machinery and remote operations. | Electrification is easiest for smaller equipment and fixed sites; batteries, trolley systems, hydrogen and efficiency expand unevenly. |
Data centres and AI | Electricity, plus diesel backup and embodied energy in equipment. | Data centres consumed 788 TWh in 2025 in the Energy Institute’s first global estimate; the carbon intensity depends on the grid. | Renewable electricity and storage can lower operational emissions, but rising demand and backup systems preserve links to the wider energy economy. |
Fusion power | No commercial contribution. | 0% of current supply. Experimental devices consume rather than sell grid electricity. | Potential post-2030s/2040s role remains uncertain; it should be separated from deployable renewables, fission, storage and efficiency in near-term planning. |
Academic source links: Deep Decarbonization Pathways for Energy-Intensive Industry | Environmental Impacts and Decarbonization Strategies in Cement and Concrete | Strategies to Reduce the Global Carbon Footprint of Plastics | Achieving Net-Zero Greenhouse Gas Emission Plastics | Magnetic-Confinement Fusion
References: [14], 960-973; [15], 559-573; [16], 374-378; [17], 71-76; [18], 398-410.
Primary / institutional evidence links: IEA Renewables 2024 | IEA Global Energy Review 2025: Oil | Energy Institute 2026 review release
6.1 Why sectoral transition speeds differ
Electricity can change relatively quickly because new wind, solar, storage and grid assets can alter the generation mix without replacing every end-use appliance at once. Transport and industry are constrained by the installed stock of vehicles, aircraft, ships, furnaces, refineries, buildings and supply chains. This is carbon lock-in: past investment shapes future demand through technical lifetime, standards, skills, finance and political constituencies. A barrel displaced in road transport may therefore be partially offset by growth in aviation or petrochemicals unless policy addresses total material and mobility demand as well as fuel substitution.
Academic source links: Carbon Lock-In: Types, Causes, and Policy Implications | Assessing Carbon Lock-in | Sociotechnical Transitions for Deep Decarbonization
References: [12], 1242-1244; [24]; [27], 425-452.
7. Emissions: from one barrel to the global carbon budget
7.1 The combustion rule of thumb
The EPA’s current equivalency methodology assigns approximately 0.43 metric tonnes of CO2 to the combustion of the products represented by one average barrel of crude oil. This is an accounting approximation based on average heat content, carbon content and complete oxidation. It is useful for scaling, but it is not a full lifecycle assessment and does not mean that every physical barrel produces exactly the same emissions.
Volume / flow | Approximate combustion CO2 | Interpretation |
1 barrel | 0.43 tonnes CO2 | Downstream combustion only; excludes extraction, methane, flaring, transport and refining. |
1,000 barrels | 430 tonnes CO2 | Illustrates how quickly a small commercial unit becomes an industrial emissions quantity. |
1 million barrels | 0.43 million tonnes CO2 | Equivalent to 430,000 tonnes from combustion. |
1 million barrels per day for one year | About 157 million tonnes CO2 | 365 million barrels × 0.43 tonnes per barrel. |
100 million barrels per day for one year | About 15.7 billion tonnes CO2 | Order-of-magnitude scaling only; actual global products, non-combustion uses and inventory changes complicate direct attribution. |
Academic source links: Global Carbon Intensity of Crude Oil Production | Carbon Intensity of Global Crude Oil Refining and Mitigation Potential
References: [19], 851-853; [20], 526-532.
Primary / institutional evidence links: US EPA Greenhouse Gas Equivalencies Calculator: calculations and references
7.2 Lifecycle variation
Combustion dominates the lifecycle footprint of most oil products, but upstream and refining differences are consequential. Masnadi and colleagues estimated a global volume-weighted average upstream carbon intensity of about 10.3 gCO2e/MJ, with large field-to-field variation. Jing and colleagues estimated a volume-weighted average refining intensity of about 40.7 kgCO2e per barrel, with results varying by crude and refinery configuration. Heavy oil, steam-intensive extraction, flaring, methane leakage and complex upgrading can therefore make one market barrel materially more carbon-intensive than another before either is burned.
Non-combustion use does not make petroleum climate-neutral. Carbon in durable plastics may be stored temporarily, but production requires energy and products eventually enter waste, recycling, incineration or environmental leakage pathways. At the same time, counting all extracted oil as instantly combusted would be inaccurate. The correct relationship is systemic: continued extraction sustains a product network whose dominant endpoint remains oxidation to CO2.
Academic source links: Global Carbon Intensity of Crude Oil Production | Carbon Intensity of Global Crude Oil Refining and Mitigation Potential | Achieving Net-Zero Greenhouse Gas Emission Plastics
References: [17], 71-76; [19], 851-853; [20], 526-532.
7.3 Scale, committed emissions and the object’s visual problem
The barrel is visually manageable and climatically deceptive. A steel drum occupies human scale; global oil supply is measured in tens of millions of such units every day. Existing energy infrastructure also carries “committed emissions”: if power plants, vehicles, industrial facilities and buildings operate for expected lifetimes, they generate future CO2 without any new technological invention. Oil wells and pipelines are only part of this commitment. Refineries, airports, highways, suburban form and petrochemical demand complete the lock-in.
Energy-related CO2 emissions reached nearly 38.4 Gt in 2025. Oil remained the second-largest source after coal, primarily through transport. The object therefore performs a scale conversion: it asks the viewer to understand a globally distributed atmospheric process through a standardised commercial container.
Academic source links: Committed Emissions from Existing Energy Infrastructure Jeopardize 1.5 °C Climate Target | Assessing Carbon Lock-in
References: [21], 373-377; [24].
Primary / institutional evidence links: IEA Global Energy Review 2026: CO2 emissions | IEA World: Oil
8. The future of oil production
8.1 There is no single forecast
The future of oil depends less on geological exhaustion than on policy, technology, demand, conflict, capital cost and the speed of infrastructure turnover. Contemporary scenarios diverge sharply because they encode different assumptions. The IEA’s 2025 Stated Policies Scenario has demand peaking around 102 million barrels per day near 2030 and then declining gradually. Its Current Policies Scenario reaches about 113 million barrels per day in 2050, supported by trucks, aviation and petrochemical feedstocks. A net-zero pathway requires much faster electrification, efficiency and demand reduction, and therefore a far steeper contraction in oil use.
Scenario / horizon | Oil trajectory | Underlying logic | Implication for production |
Short-term market outlook, 2026-2027 | Highly volatile and contingent on conflict, transit, inventory and supply recovery. | Balances can change faster than physical investment because stocks and outages move immediately. | Existing capacity, spare capacity and short-cycle production dominate; price forecasts are fragile. |
IEA Oil 2025 market outlook to 2030 | Demand rises modestly to a plateau around 105.5 mb/d by the end of the decade. | Road-fuel growth weakens while aviation and petrochemicals continue expanding. | New capacity can exceed incremental demand, increasing competition and closure pressure on high-cost assets. |
WEO 2025 Stated Policies Scenario | Peak around 102 mb/d near 2030, then gradual decline. | EVs exceed half of new car sales by 2035; 840 million EVs displace about 10 mb/d. | Production shifts toward low-cost and lower-decline resources; some projects and refineries face under-utilisation. |
WEO 2025 Current Policies Scenario | Oil demand rises to about 113 mb/d by 2050. | No additional policy beyond the scenario’s current-policy assumptions; freight, aviation and petrochemicals sustain growth. | Continued upstream investment and infrastructure expansion remain economically plausible but climate-incompatible. |
Net-zero / 1.5 °C-compatible pathways | Rapid decline in unabated fossil use. | Electrification, efficiency, modal change, material circularity and limited residual fuels align demand with a carbon budget. | Large shares of reserves remain unextracted; high-cost, high-carbon and long-lived projects carry greatest stranding risk. |
Fusion-led expectation | No credible commercial contribution in current energy statistics and uncertain deployment timing. | Fusion research may eventually add firm low-carbon electricity but does not directly replace liquid fuels without electrification or synthetic-fuel chains. | It cannot justify near-term oil expansion or substitute for deployable transition measures. |
Academic source links: Unextractable Fossil Fuels in a 1.5 °C World | Fossil Fuel Supply and Climate Policy | Magnetic-Confinement Fusion
References: [18], 398-410; [22], 230-234; [23], 1-13.
Primary / institutional evidence links: IEA World Energy Outlook 2025: Stated Policies Scenario | IEA World Energy Outlook 2025: Executive summary | IEA Oil 2025: Executive summary
8.2 Production decline, new investment and the timing problem
Oil fields decline naturally as reservoir pressure falls, so maintaining a flat level of supply requires continuing investment even when long-term demand is expected to fall. This fact is sometimes used to argue that any new investment is automatically compatible with transition. The conclusion does not follow. The relevant questions are how much investment, in which fields, at what cost and carbon intensity, under which demand pathway, and with what decommissioning obligation. Short-cycle investment in existing fields is economically and climatically different from a multi-decade frontier project whose payback assumes prolonged high demand.
A disorderly transition can fail in two directions. Underinvestment relative to continuing demand can produce shortages and price shocks. Overinvestment relative to a climate-compatible decline can lock in emissions, strand assets and transfer losses to workers, pension funds and producing states. A managed transition therefore requires both demand-side transformation and supply-side governance, not an exclusive focus on either consumers or drilling.
Academic source links: Fossil Fuel Supply and Climate Policy | Macroeconomic Impact of Stranded Fossil Fuel Assets | Stranded Assets in the Transition to a Carbon-Free Economy
References: [23], 1-13; [25], 588-593; [26], 281-298.
8.3 What is most likely to change first
Likely earlier change | Likely slower change | Reason for difference |
Oil-fired electricity where alternatives and grids are available. | Aviation and ocean shipping. | Electricity has mature substitutes; long-distance transport requires high-energy-density fuels and global infrastructure standards. |
Passenger-car fuel demand in markets with strong EV policy and charging. | Heavy off-road equipment and long-haul freight in weak-grid regions. | Vehicle duty cycle, charging power, cost and fleet turnover differ. |
High-cost or high-carbon frontier projects under weak demand. | Low-cost production with existing infrastructure. | In a shrinking market, cost, carbon intensity and geopolitical strategy shape which barrels remain competitive. |
Some single-use plastics through regulation and reuse. | Bulk petrochemical feedstocks for construction, medical, textile and industrial applications. | Substitution and circularity are product-specific; demand is not reducible to a single plastic category. |
Refinery closures in structurally declining markets. | Integrated export refineries and petrochemical complexes in growth regions. | Regional demand and product trade redistribute rather than uniformly eliminate capacity. |
Corporate rhetoric and portfolio diversification. | The hydrocarbon share of major producers’ cash flow and reserves. | Financial and material systems change more slowly than branding or isolated pilot projects. |
Primary and institutional evidence links
The following sources support exact standards, current statistics, forecasts and operational facts. They are not included in the numbered academic bibliography.
1. American Oil & Gas Historical Society. “History of the 42-Gallon Oil Barrel.”
2. Petroleum History Institute. “Standardization.”
3. Energy Institute. Statistical Review of World Energy 2026.
4. Energy Institute. “Global Electrification Reaches Tipping Point…” 30 June 2026.
5. International Energy Agency. Global Energy Review 2025: Oil.
6. International Energy Agency. Global Energy Review 2026: Global Trends.
7. International Energy Agency. Global Energy Review 2026: CO2 Emissions.
8. International Energy Agency. Renewables 2024: Global Overview.
9. International Energy Agency. World Energy Outlook 2025: Stated Policies Scenario.
10. International Energy Agency. Oil 2025: Executive Summary.
11. International Energy Agency. Strait of Hormuz.
13. U.S. Energy Information Administration. Short-Term Energy Outlook, July 2026.
14. U.S. Energy Information Administration. World Oil Transit Chokepoints.
Numbered Academic Reference List
Chicago bibliography style. This numbered list contains only scholarly books and peer-reviewed academic articles. Institutional and statistical sources are listed separately above.
3. Bridge, Gavin, and Philippe Le Billon. Oil. 2nd ed. Cambridge: Polity, 2017.
4. Mitchell, Timothy. Carbon Democracy: Political Power in the Age of Oil. London: Verso, 2011.
5. Barry, Andrew. Material Politics: Disputes Along the Pipeline. Chichester: Wiley-Blackwell, 2013.
10. Ross, Michael L. “Does Oil Hinder Democracy?” World Politics 53, no. 3 (2001): 325-361.
Appendix: User prompts related to this report
Prompts are reproduced chronologically as a research-process record. The Hungarian instruction has been translated into English and consolidated only to remove repetition while preserving every substantive research and formal requirement.
1. Directed research brief — 27 July 2026
Prepare an English-language report on the oil barrel, taking the attached study as the initial research basis. Investigate the history of oil extraction; present-day extraction, refining, transport and storage infrastructure; the future of oil production; historical and current prices; the economics and market organisation of petroleum production; the changing relationship between oil and renewable energy; and the degree to which different industries depend on fossil fuels, oil, coal, nuclear energy, prospective fusion energy and other carriers. Include a source-critical history of the oil barrel itself, especially its standardisation as the 42-US-gallon / approximately 159-litre trade unit.
The exhibition object is titled “Drill baby, drill!” Its provisional description states: “The 42-gallon (159 litres) barrel became customary in 1866 and was adopted by the US Petroleum Producers Association in 1872, and it serves as a saleable unit for crude oil. Its price peaked in 2008. In 2022 oil contributed 30% of the global energy supplied while producing 32.7% of combustion emissions.” Verify, qualify and update these claims where necessary rather than repeating them uncritically.
Continue according to the project criteria established at the beginning of The Sunshine Find / Glacial Archaeology research. Begin with an abstract of no more than 200 words. Use a unified narrative and typographic structure consistent with the approved report series, including the required heading hierarchy and cross-references to related objects and reports. List only valid scholarly and peer-reviewed sources in a numbered Chicago-style Academic Reference List at the end; distinguish official and institutional evidence from academic scholarship.
2. General remarks and new request:
1. I have been asking you to create individual reports on different topics, in this case the train service and model of Glacier Express.
2. Nonetheless these materials should converge into a unity which is the archive itself and the supporting physical installation. This convergence should be based on a synthesys of all of my other topics, questions and criteria raised in all of the other chat sessions, which are all part of the same project the main scope of which is an art installation and a supporting archive that grows by time. The archive is meant for both professional and nonprofessional use, it should be informative within its artistic and pedagogical scope as well.
3. the main line of thoughts of the project departs from panoptic tourism and concludes to ecoterrorism in a narrative line. Therefore all the reports should follow this general direction in their approach and references.
4. The reports we are working on now will all serve as a background research material published on the project website for the set of objects that will be on display, Each object will have its own page (see: https://glacial-archaeology.net/category/exhibition/). See: Szabolcs KissPál – The sunshine find_for translation. I am also adding the brief description of the project’s general concept, see: Szabolcs KissPál – The sunshine find. The website will have a separate but interconnected section for both the exhibition and the supporting archive. https://glacial-archaeology.net/an-archive-of-narratives-on-global-warming-copy/ Inspect the site while note that it doesn’t have its final structure yet!
5. the scope with the reports is to produce a set of background research material for each object in part that should refer to each other, and should be unified in their narrative and typographic structure, tone, and scope. Pay attention to snychronise the focus points of different partial research tasks when possible with cross references!
6. I am attaching two of your previous reports (noahs_ark_expeditions_1959_1990_academic_sources_new_tab_links.docx, Container_Mount_Scorluzzo_WWI_Shelter_Research_Report). Please develop and and apply to these reports a uniform structure both content wise and in formal aspects while mostly keeping their original content.
7. Main further formal criteria:
– you should always start with an abstract summarizing your finds in a text no longer than 200 words.
– you should always enlist at the very end of the document all my prompts related to that topic
– the external links should always open in a different tab
– you should be using only valid, peer reviewed academic sources listed and numbered at the end of the documents
– you should apply a somewhat unified narrative structured and a unified formatting (including typeface styles, subtitles structure, etc.
8. – note and memorise the above in your cross-chat memory for rurther tasks
– return the three reports keeping their main content but slightly modified (!) according to the above